CPU Profiling a Meteor App
If you need to see what exactly is happening inside your app, the best option is to take a CPU profile. It is not easy to take and analyze a CPU profile with NodeJS; we need the right set of tools and guides, which is what we are doing with Kadira’s CPU profiler.
v8-profiler
We are actually using the v8-profiler from the node-inspector to take a CPU profile of your app. To install that, simply add this meteor package into your app.
meteor add meteorhacks:kadira-profiler If you are using a older Meteor version, add this package with:
mrt add kadira-profiler.
The v8-profiler uses some internal APIs of v8 (the engine that NodeJS runs on) to profile what’s happening in your app. Consequently, this solution works everywhere, whether your app is hosted on AWS, modulus.io or even at meteor.com.
This is a sampling profiler: it samples functions and stacks that are on the CPU and provides a report that we can analyze. We’ll talk about this more in a separate article.
Taking a CPU profile - for a production app (remotely)
Taking a CPU profile is easy:
- visit the Kadira dashboard,
- click on the profiling tab,
- create a new CPU profile for 10 seconds – you will get a code, as below.
- copy that code and paste it into your app’s browser console,
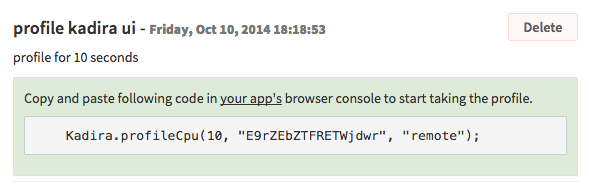
- after 10 seconds you’ll be able to analyze the profile.
Watch this demo
Taking a CPU profile - for a dev app (locally)
- run your Meteor app with
KADIRA_PROFILE_LOCALLYenvironemental variable - open your app’s browser console and paste following code (to profile for 10 secs)
Kadira.profileCpu(10)- Check server logs to get the location of saved CPU profile
- Visit Kadira UI and analyze the taken CPU profile
Watch this demo
Preparation
Although the v8-profiler is a handy tool, it comes at a cost. While it’s profiling, it will consume two to three times the CPU time. But what it gives is so useful, and since it takes a very limited amount of time, this should not be an issue at all.
Additionally, consider the following recommendations:
- always profile for less than 1 minute.
- if possible, increase the CPU power of your server (adding multiple CPUs/cores does not work here).
- if possible, scale your app horizontally during the profiling time.
Analyzing the CPU profile
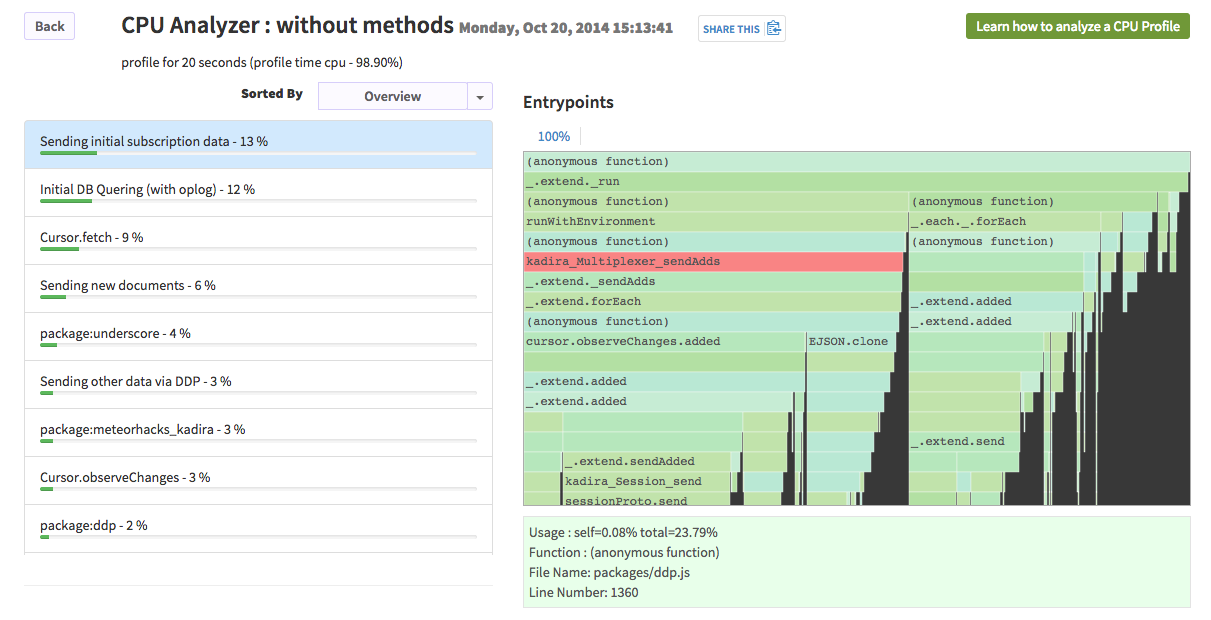
Getting a CPU profile is not that hard: the hardest part is trying to analyze it. You need some understanding of the meteor internals and a good tool to analyze the profile.
Chrome dev tools comes with a built-in tool to analyze a CPU profile, which works up to an extent. Flamegraph is known to be the best way to analyze a CPU profile but usually contains more data than we actually need.
So, we took the best of both methods to implement a CPU analyzer that really works and is very easy to work with. The next article will describe how to analyze a profile.